New Methods Unlock Blazar Secrets
Blazars are the special class of active galactic nuclei (AGN) which are known to have very high variability that can be used extensively to study these compact systems and is determined by characteristic timescales. The real observational light curves suffered with issues such as noise and gaps. If left unaddressed, these issues could affect our understanding of the behavior of these objects significantly.
Ashutosh Tripathi from Xinjiang Astronomical Observatory, Chinese Academy of Sciences, along with his collaborators, have applied the advanced time-series analysis methods to the one-year long Transiting Exoplanet Survey Satellite (TESS) of the radio blazar 3C 371.
This study was published on 26th November 2025 in Monthly Notices of the Royal astronomical Society (MNRAS).
The data was analyzed using power spectrum density, structure function, and weighted wavelet Z-transform approaches and estimate the characteristic timescales. To mitigate the effects of gaps and noise in the light, continuous auto-regressive moving averages, Barlett’s periodogram, and wavelet decomposition methods are used.
“We found that these methods provides similar results if the gaps are small but differ significantly when the gaps becomes larger. When the noise is reduced, the significance of a signal present in the data also increases. Using these advanced methods, we also found the Quasi-periodic signal of around 5 days with 50 cycles which could be related to the presence of sub-structures within the jets or the temporal evolution of plasma-driven kink instabilities.,” said Ashutosh
ThIs study is useful for subsequent studies of variability of AGNs not only with TESS but also with other multi-wavelength observations and for reducing the effects of noise and gaps in the observations.
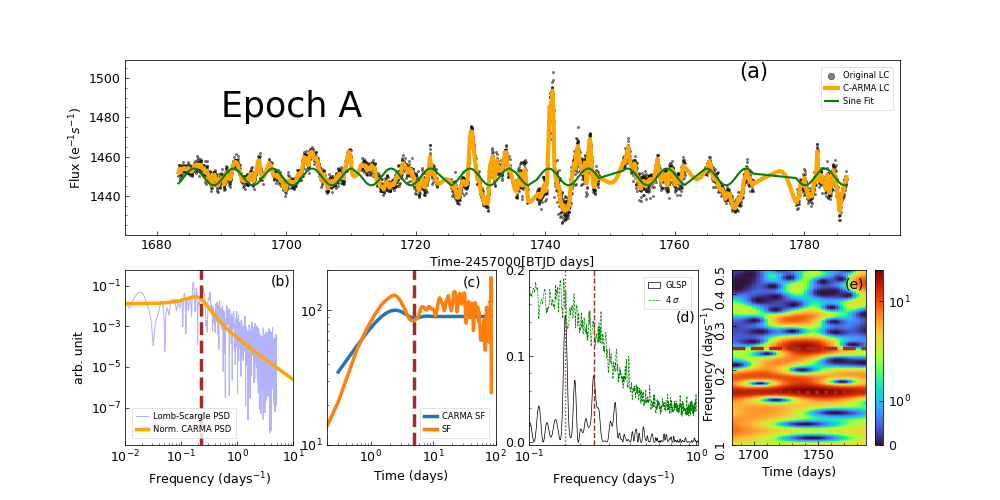
Timing analysis results for epoch A. The light curve for epoch A is plotted in panel (a) along with the C-ARMA generated light curve and a sine fit with a period of 6 d. Panels (b) and (c), respectively, show the PSD and SF calculated directly from the observations and from the C-ARMA fit. Panel (d) shows the GLSP results along with the 4σ significance curve. The brown dotted and brown dashed curves, respectively, correspond to a possible quasi-periodic and a variability frequency. The corresponding WWZ colour–colour diagram is plotted in panel (e). The QPO and variability frequencies are denoted by black dotted and brown dashed curves, respectively.
Attachment Download: